The Ultimate Guide to Sales Strategy
Chapter 5
Measuring Success with Sales Reporting

How to Understand Sales Performance
You’re tracking your sales pipeline, creating awesome proposals, and offering low-friction financing options; but what does it all mean? This is where sales reporting comes into play.
It’s essential that you have eyes on the numbers or you may miss opportunities to make vital improvements. The good news is, that by taking this more methodical approach to your sales strategy, you’re setting yourself up to better measure your selling performance at each stage.
- Are you closing enough deals?
- Are your jobs profitable?
- Is anyone in your team underperforming?
To do sales well, you’ll need to be able to answer all of the above and more.
The great thing is, numbers don’t lie. Sales reporting tools can help you pinpoint and record specific sales pipeline metrics that are crucial to the profitability of your business. Taking the time to understand the different successful aspects of your sales strategy will allow you to see what’s going well, what you can do better, and help you lay out a plan for better results in the future.
Sales Reporting with Metrics and KPIs
Key Performance Indicators (KPIs) are vital, and specific, metrics that measure your success. They bring your sales reporting to life. You’ll need to think about exactly which sales KPIs make sense for your business, industry, and team, as there’s no one-size-fits-all approach to sales metrics.
Of course, the biggest indicator of all is the bottom line: how much money is your business making? However, by tracking multiple sales KPIs, you get a much more complete assessment of your sales strategy and both its strengths and weaknesses.
Total Opportunities Won
Simply, this is the total number of deals marked as won within a certain timeframe.
Ex: Six new deals in the previous week.
The Total Value of Opportunities Won
You should know the total income generated from all won deals within a certain timeframe.
Ex: $55,000 for the six won deals from the previous week.
The Total Profit of Opportunities Won
The total income generated from all won deals, minus the operational costs of those jobs.
Ex: The six new jobs will contribute to $30,000 in profits.
Win Rate
The total number of opportunities won, divided by the total number of opportunities.
Ex: You won six out of 10 opportunities, meaning your win rate is 60%.
Total Open Opportunities
This is the total number of opportunities still in progress.
Ex: There are five deals in various selling stages within your team pipeline.
The Total Value of Open Opportunities
Your team should always know the total (estimated) value of all opportunities still in progress. This represents current sales potential.
Ex: The total value of the five open opportunities is $45,000.
Profit per Type of Work
This report covers the total income generated from all won deals within a certain category, minus the operational costs of those jobs.
Ex: Three installations will contribute to $20,000 in profits.
Avg. Length of the Sales Cycle
This covers the average time (in days) that it takes from adding a new opportunity to winning the deal.
Ex: The average time for a prospect to become a customer is 14 days.
Revenue From Add-Ons
You should understand the total value of all sold add-ons in isolation.
Ex: Add-ons contributed to +$1,000 in revenue for the previous week.
The Total Value of Discounts Provided
This report tracks the total value of discounts provided in won deals. This metric is assessed by how low the value is.
Ex: The six won deals had $800 in discounts, combined.
How to Turn Sales KPIs into Business Insights
Now that you have an idea about which sales KPIs to measure, the challenge still remains, how do you extract insights from them? Essentially, you know your numbers… but what do they really mean?
The reality is it will take time and effort to analyze your sales reports. You’ll need to investigate multiple sales metrics, assess your sales team’s sales performance metrics, and ask yourself the right questions. However, it’s absolutely worth generating sales reporting on a regular basis; there are many automated sales report tools. Understanding company numbers is the only way you can move your business forward with confidence.
Let’s look at a theoretical example and examine some high level questions you may need to think about.
“Total deals won is increasing, but total profit is not matching”
Your sales team is closing more deals than before, but the total value of those deals is lower too. Essentially, you’re creating more work, but not creating much more money.

Questions to Ask When Analyzing Your Sales KPIs:
Are you winning the sort of jobs you want?
- Every business will have low-margin and high-margin work; is it possible your marketing is attracting too much low-margin work?
- Is your sales team over-prioritizing low-margin work because they are easy wins?
Where in the pipeline are you losing high-margin opportunities?
- Are they reaching the proposal stage? If yes, you may want to review your proposals and follow-ups to see if they can be improved
- Do you simply have fewer high-margin inquiries than before? Should you consider reviewing your marketing?
Have your costs increased?
- If your costs have increased, have you reflected that in the price you charge?
Is your team offering too many discounts in order to win jobs?
- Discounts are a double-edged sword. They can be the push that a prospect needs, but too many will hurt profitability. You may need to talk to your team.
Is your team selling less add-ons?
- Add-ons can be a substantial contribution to your revenue. Is your team including them in proposals? If customers are not choosing them, you may need to review which add-ons you include and their price.
Setting Goals with Sales Reporting
Company Goals
Goals are critical in order to benchmark your success. Defining yearly, quarterly, and monthly goals can help give you perspective on whether your sales strategy is working. Sales reporting is where you gauge the impact of your goals. Further, a sales budgeting system will help your team understand how each of your services affects business profits. You’ll need to base these goals on your running costs and your overall company objectives.
For example, if you wish to hire another five employees next year, how much money do you need to make this year to make such an investment feasible?
You may find that you need to change or revise your goals as the year goes by. If you are blowing your goals out of the water with minimal effort, you might consider increasing them. Meanwhile, external factors or staff changes may make it near-impossible for you to reach other goals, in which case they may need to be reevaluated.
Team Goals
Individual teams should have goals too, which will feed into your overarching company goals. It’s important that these team goals are achievable and that you link them to initiatives you and your team are actively taking. If you wish to increase your win rate by 10%, what exactly will you do to achieve that goal? Telling your team that you expect them to drive up their numbers, without a plan to do so is a surefire way to cause frustration.
Individual Employee Goals
Employees (especially those making sales) should understand what is expected of them and how they contribute to the bigger picture. If you expect $X revenue from your sales team, how much of that needs to be contributed by whom? You should base individual goals on an employee’s seniority, experience, and track record to make sure they are reflective of their potential.
Each salesperson should know their personal sales goals, how they help make up the team goal, and ideally understand the context of why their goals are important to the company’s overall objectives.
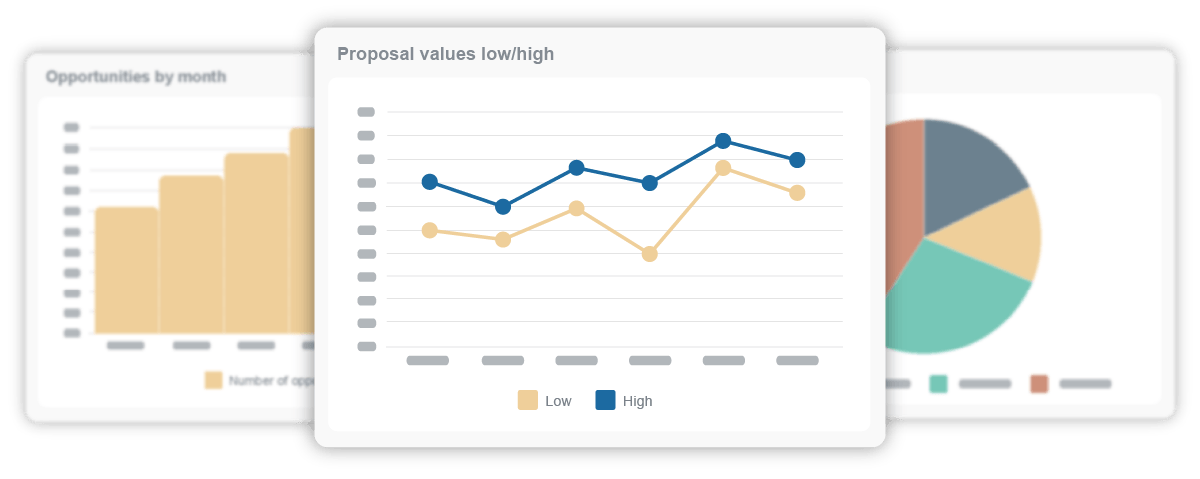
Learning From Your Proposals
A valuable sales report to build is one that measures the effectiveness of your sales proposals. Beyond the quantifiable numbers of your sales metrics, it’s also revealing to analyze your sales proposals and assess them from a qualitative perspective – are they as good as they can be?
Take time to reflect on your lost proposals and see if you can glean any insights into why it wasn’t successful. If you were able to record the reason that the customer didn’t accept at the time, then this is your opportunity to assess that further. Was it anything that you could change? Are you displaying value, expertise, and trust that aligns with your prospect?
This is how you learn and improve. Furthermore, your sales team can compile a list of lost prospects to follow up with or revisit in the future. Just because the prospect wasn’t ready to move forward with the service you offered, doesn’t mean they won’t have a need for your business in the future.
It’s just as important to understand why you’re winning proposals, as it is to understand why you lose them too. Obviously, winning highlights what you do well. But is there anything from your successful proposals that you could replicate in others? Understanding the specific reasons why prospects pick your proposal over another will help you scale your business and provide better service.
You may even find you need to shake your proposals up as time goes by. Don’t be afraid to revisit the structure and design of your proposals to make sure you have a fresh and up-to-date look.
Question
Do you know your sales conversion rate (the percentage of your leads that turn into paying customers)?
Fantastic! Do you wish it was higher? It’s great that you have access to this reporting and it shows you’re taking your sales strategy seriously.
Your next steps could be to simplify the recording and analysis of this data – or to dig down into additional sales metrics or KPIs, like performance by salesperson, profit margins per job. If you’d like to hear about a new way that trades businesses can report on their sales strategies, learn more here!
Understandable! It’s incredibly difficult without the proper tools and processes in place to track this data. However, if you really wish to evaluate and analyze your sales strategy as you go, it’s essential. Otherwise, you’ll simply be making blind stabs in the dark.
The best solution is for your pipeline tools (where you record each opportunity) to work alongside your sales reporting software, so you have one set of data to work with – a single source of truth. If you’d like to learn about a solution like this, designed for trades businesses, learn more here!