
The Ultimate Guide to Sales Strategy
Chapter 2
Mastering Your Trades Sales Pipeline

What is a Sales Pipeline for the Trades?
Once you’ve adopted a sales mindset, the next thing to master is how to structure the sales process itself. By taking a methodical approach, planning each step of the process, and implementing it with a sales pipeline, you’ll be setting yourself up for success from the start.
Prospect
The stage after lead. A potential customer who has entered your Sales Pipeline and will move through your sales process.Ask yourself, how often have you lost track of an inquiry, quote, or simply forgotten to call someone back? Too many times to count? It’s understandable: Sales is full of constantly moving pieces.
Of course, with that being the case, it’s exactly why a Sales Pipeline is so important. Don’t underestimate the significance of having a reliable, transparent, and repeatable structure that you can use to manage sales in your business.
To get you on the road to being a sales pipeline master, we’ll:
- Discover the benefits of sales pipeline management
- Review what a sales pipeline looks like in practice
- Flesh out every stage of the pipeline (with recommendations for each!)
Sales Pipeline Management
All sales teams should use a pipeline to organize their opportunities from inquiry to close. Trades businesses, no matter how many sales they are currently making, will benefit from this structured process to manage their sales.
Sales Opportunity
An opportunity is a chance for you to win new or returning business from a prospect.With effective pipeline management, trades companies can expect to:
- Consistently move prospects through the sales cycle
- Reduce the number of prospects that fall through the cracks
- Avoid confusion as to who is responsible for a prospect
- Provide a clear view of current sales opportunities (in $ value)
- Ultimately close more deals
Companies with effective pipeline management have a 15% higher average growth rate than companies with ineffective management.
— The Harvard Business Review
The goal of a sales pipeline isn’t to help you get more job requests and inquiries. Its value is entirely in how you manage inquiries. After all, many trades businesses don’t struggle to get job requests. They are more likely to struggle with the processes and resources needed to manage the volume of inquiries they do get.
Don’t worry, you’re not alone:
One in five businesses say they don’t have enough resources to process sales efficiently."
— DateDwell
By creating a sales pipeline, your team can follow a repeatable process that increases the odds of successful sales conversion. When built around good team communication and timely responses, your sales pipeline will reduce the likelihood that a prospect will slip through the net.
Sales Conversion
The act of a prospect moving forward in the sales cycle from one specific stage to another. A common example is leads converting into customers.We’ve covered the basics of how a sales pipeline can help your business, but what exactly does this look like in practice?
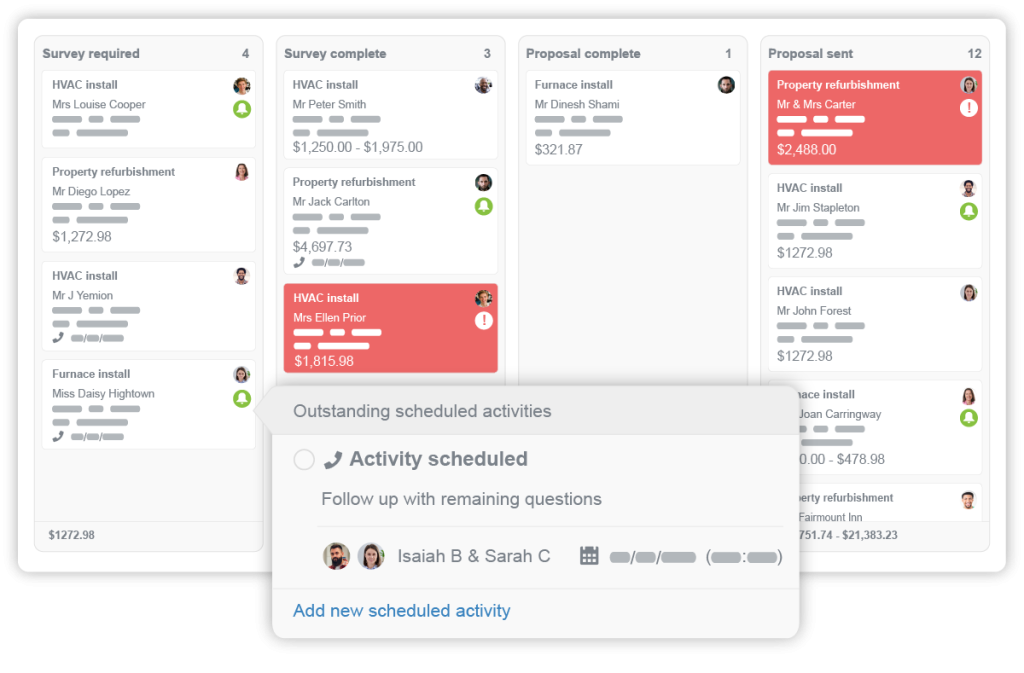
What Does a Sales Pipeline Look Like?
Sales pipelines will naturally vary from business to business, but a typical example for installation work and larger jobs would look something like below.

Every inquiry that your business is currently handling should fall into one of the example pipeline stages. Of course, different trades businesses may find they need to customize the stages to suit their own sales processes or may need entirely different pipelines to manage and track different types of work, such as commercial maintenance or repair, or by different workflows, such as boiler or HVAC system installations. There’s no limit to the number of stages or pipelines your business employs, as long as they remain useful.
You could manage your pipeline on a large whiteboard, with a complex spreadsheet, or by using a dedicated sales system. Specialist opportunity management software designed for trades businesses will be your best bet to achieve the customization, flexibility, and ease-of-use that you will ultimately need to make your pipeline (and therefore your sales strategy) successful.
How to Build a Sales Pipeline
Let’s run through each stage from our example pipeline. To help you grow your sales, we’ve paired each stage of the pipeline with a recommendation intended to help you move opportunities from that stage to the next.

1. Inquiry Made
Every new inquiry sits here waiting to be actioned by your team. How an inquiry was made will of course impact exactly what happens next. If you were left a voicemail, sent an email, or otherwise received an online inquiry (such as a website form submission), you’ll need to promptly follow up with the lead to discuss their needs, time frame, and expectations.
Knowing who is assigned to handle each opportunity at this stage is vital or you risk nobody following up at all. Your team’s main goal will be to qualify leads and assess whether they need to conduct a site survey (then try to get one arranged as soon as possible).
Recommendation: Be Quick to Qualify
At this beginning stage of the sales cycle, it’s essential that you act quickly. No prospective customers want to sit around waiting for a response – and it will only increase the likelihood that they find alternative solutions (such as your competitors). After all, did you know:
New leads are nine times more likely to convert if you follow up within the first five minutes after they express interest
— Keap
However, you also don’t want to blindly steamroll ahead with leads. You need to make sure that your team is also qualifying leads at the same time. As soon as a lead requests to learn more about your services, your team also needs to gauge if they’re a good fit for your business. You don’t want to waste time moving them through your sales pipeline, only to discover that the solutions you offer won’t be suitable, are out of the prospect’s budget, or can’t be completed within their required timeframe. This is why qualifying questions at the initial inquiry stage are so important.
To qualify a lead, you’ll need to ask a variety of questions to better understand their needs. With these questions, you’ll gather as much information as you can to wholly assist them.
Example qualifying questions:
- What do you ultimately want to get out of this product/service?
- What is the space like where the work needs to be done?
- Will this replace an existing appliance? (Plus any relevant technical questions relating to that)
- What is your price range? (Avoid setting a certain price cap, a range automatically assumes flexibility from the start)
- When were you hoping to begin this work?
- When do you need this finished by?

2. Survey Booked
Once a lead has been qualified and deemed a good fit for your business, the next typical step is to book a survey. Prospects in this stage of the sales pipeline should have had their survey booked, but not yet completed. If the type of job doesn’t require a survey, you could move straight ahead to creating and sending a proposal. You may also be able to bypass the in-person survey if you’ve visited the property before, if you are able to conduct a virtual survey (almost everyone is comfortable with video calling these days), or if the prospect is able to send you a few site photos instead.
Recommendation: Be Consultative
Selling works best when your prospect trusts you. To gain their trust, your team needs to be invested in conversations, demonstrate the value of your services, and ask questions that make prospects genuinely think about their problem and the solutions available.
This is known as consultative selling. Fundamentally, consultative selling is part of offering great customer service and building trust with prospects. Do it well and prospects will not only become customers, but will likely return in the future, and highly rate and recommend your business as well.
The consultative selling approach is all about listening to – as well as challenging – the prospect’s understanding of their needs. Remember, you are the expert. It’s your job to get to the bottom of what they need (and want) and present the best solution you can. When a salesperson or technician is present at a property, this is their opportunity to display that expertise and earn the prospect’s trust. With the right questions, insights, and technical knowledge you’ll be able to guide prospects toward the right solution for them, time and time again.
Consultative Selling
A selling strategy that focuses on building trust with prospects by tailoring conversations around their needs and then devising solutions to fit.
3. Survey Completed
Following a successful survey, the assigned salesperson will need to create a bespoke proposal based on the prospect’s needs. The prospect will remain in this stage of the sales pipeline until that proposal has been sent. It is advisable to set an expectation with your team as to how many days they have in order to send the proposal. Of course, with all stages of the sales cycle, speed is your friend.
Proposal
A comprehensive document that presents the specific details of work or service that is requested by a potential client.Recommendation: Be Persuasive
When you build and send your proposal, it’s vital that you remember that your goal is not to simply inform the prospect, but to persuade them too. Ask yourself:
- Does your proposal display the value of your offering?
- Does it show that you understand the prospect’s unique needs and situation?
- Do you communicate your company’s reputation and expertise?
- Does it look professional and impressive?
- Does it entice prospects to take the next step?
We’ll cover how to create effective proposals further in the next Chapter of the Ultimate Sales Strategy Guide.

4. Proposal Sent
Now that your team has surveyed the site, collected the relevant information, and built and sent a proposal to the prospect, it’s time to wait (at least initially). At this stage you’ll need to trust the process and wait for the prospect to reach out with questions, accept the proposal, or reject the proposal. However, you won’t be waiting for long. If you haven’t had a response to your proposal within a certain number of days, you’ll then send a follow up and move the opportunity to the next stage of the sales pipeline.
Recommendation: Be Aware of Decision-Makers
It’s vital that you are communicating with the decision-makers by this stage of the sales process. In many cases, decision-makers will have been easy to identify, but if you have any doubts, now is the time to address them. After all, you don’t want to send the proposal to somebody who is ultimately not going to make the decision.
It’s okay to simply ask the prospect if there is anyone else who will get a say in the decision or make the final call – and whether you could include them in your communications.
Typically this is more of a problem for commercial work where you may find yourself communicating with a manager, though it’s realistically their boss that will sign off on the proposal.

5. Follow-Up Sent
Should you not receive a response to the proposal in the set number of days, it’s time to reach out and see what’s going on. By moving opportunities to the final stage of the sales pipeline, you can easily track who has received a follow-up and who hasn’t to ensure no follow-ups are missed.
Although this is a single stage of our example sales pipeline, it doesn’t mean that only a single follow-up should be sent. If you get no response, you may need to call or email again a few days later (perhaps even multiple times). In time, you’ll learn to recognize how many follow-ups are typically needed for your line of work – and generally speaking you can expect the more expensive the job, the longer the decision-making process.
A simple email or text confirmation can make a big impact on the experience someone has with a company.
- 80-90% of people positively view confirmations and reminders.
- Sending personal reminders can reduce missed appointments by 10%.
- An appointment confirmation email can lead to a 79% acceptance rate.
If you’d like to learn more about confirmation emails, see our blog here.
80% of deals require five follow-ups, but 44% of sales reps give up after one follow-up.”
— HubSpot
It’s important to be assertive (but not aggressive) when following up. Be prepared to adapt your response and tone depending on the prospect’s situation. If they’ve been away or ill, give them time to review before following up at a later date. If they’re weighing up an alternative quote from a competitor, make sure they understand what sets your business apart. And if they wish to negotiate, have an honest conversation about their objections and the best options you can offer them for their budget.
Recommendation: Be Proactive
Taking your sales strategy to the next level requires your team to be proactive at all stages and to close the deal however possible. You may of course need to follow up or prompt the prospect throughout the entire pipeline e.g. in order to get a survey booked, to request any missing information, or to accept your proposal. Opportunity management software can help your sales team optimize each stage of your buyer’s journey.
The important lesson here is to be proactive. Don’t hesitate to reach out to prospects when you need to – and certainly don’t sit and wait for them to come to you. This doesn’t mean you should never give people time to make decisions and digest the information you’ve provided, but it means that you should have a plan of what to say next (and when) to maintain the momentum.

6a. Opportunity Won
Success! Congratulations, your prospect has accepted your proposal and you can now consider the opportunity as “won”: they’ve reached the end of your sales pipeline!
Your customer has clearly been convinced by your company’s professionalism, organization, and top-notch proposal. Now all that’s left is for you to do the job itself.
If you’re also looking for a better process to manage and complete your day-to-day jobs, make sure you check out Commusoft’s job management software.
Recommendation: Be Smart, Take a Deposit
Although you’ve won the deal and the customer has agreed for you to complete the work, there’s always a risk that they might drop out at the last minute – or even withhold payment. If you don’t already take deposits, it’s best to be smart at this stage and protect yourself with one. This is especially vital if you will incur upfront costs such as purchasing parts and materials before you can start the job.
Make sure you include the payment schedule and any deposit details in your proposal – you don’t want to catch customers off guard. It’s also best to explain why you are collecting a deposit to help address any concerns your customer may have.
If you have access to an online proposal portal, you can empower customers to pay the deposit at the same time as they accept your proposal. Two birds, one stone!

6b. Opportunity Lost
Unlucky! Sadly, your prospect didn’t accept your proposal this time. There’s many reasons this can happen – perhaps they were too restricted on time and budget for what you could offer, they found a better fit with another company, or could have decided to not go through with the work at all.
It’s helpful to remember that sales is a game of averages. You win some, you lose some. But your goal isn’t to win them all, your goal is to win more than you lose.
There’s no need to beat yourself (and your team) up over every lost deal. If you can, try to step back and assess the big picture first. You can even backtrack through your sales pipeline to explore events at each different stage.
But remember: a lost deal also doesn’t have to be the end of the road for that potential customer. A prospect may come back around in the future! Their needs may change and they may find that your business is now a better fit (and you’ll be ready to actively market to them in the future, too). It pays to remain polite and courteous in all your interactions, especially during the frustrating moment when they reject your proposal – after all, you don’t want to burn any bridges.
Recommendation: Be Curious
While you don’t need to fret over and dissect every aspect of a deal as soon as it is lost, it is important to try to understand one thing early on: why did the customer not choose your business?
This can be as simple as “price”, “timing”, “bad fit”, etc. But if you don’t get this information while it’s fresh, you will find it very difficult to discover later on when you wish to review and assess your proposals in more depth.
You may find that a prospect tells you why they didn’t accept, e.g. “Sorry we’ve gone with a cheaper option”. But if they don’t, there’s absolutely no problem in being curious and simply asking them. If you position this as a learning opportunity for your business (which it is!), prospects may be more inclined to share why, as long as you ask politely and non-confrontationally.
You could ask something like:
“We were sad to see you didn’t choose [company name] for your [job type]. We’re always looking to improve how we communicate the value that we offer our customers. If you don’t mind sharing, why is it that you didn’t move ahead with us this time? This information really helps our team understand and improve. Thank you in advance!”
Question
How challenging do you find tracking and following up with inquiries?
It’s not surprising! Trades inquiries come in all different shapes and sizes; from emergency call outs to full installations. Keeping track of all of those without the right tools and processes is difficult. That’s why you need to work smarter, not harder!
With a stage-by-stage pipeline to track your opportunities, you’ll be able to keep tabs on all the moving parts and see exactly who needs following up with.
Right down the middle! Most likely you’ve learned to navigate the difficulties you do experience – or have at least grown used to them! But how would your customer satisfaction – or team happiness improve if you could limit those difficulties even further?
Properly implementing a sales pipeline can give you the transparency you need to eliminate admin challenges and ensure you follow up with inquiries in a timely fashion.
That’s amazing – what’s your secret? If your processes are already working for you, don’t forget there are other ways to optimize your sales strategy too. Are you happy with the documents you send to your prospects? Do you want to maximize your profits and margins for each job?
If you’re looking to take your sales strategy even further, continue reading Chapter 3 for more insights.